Practical - 9
Aim: Execute queries in the Neo4j graph database and in Gephi tool perform the operation of loading CSV data, running graph statistics scripts and displaying various graphical layouts.
What is graph data?
Graph data science is connected to data science, where relationships are first-class citizens and the connections between your data points can be used to make a better, more accurate prediction.
How graph data is stored? and how it is represented?
Graph data is kept in store files, each of which contains data for a specific part of the graph, such as node, relationship, labels and properties. A data graph is a visual presentation of data, from which we can quickly grasp comparisons and trends more easily.
How to visualize graph data and devise conclusion/result?
We can visualize graph data by looking at the graph properly and we can get the effective information that reveals structures that may be present in the graphs and help the user to understand that.

Neo4j
Neo4j is the graph database platform powering mission-critical enterprise application like artificial intelligence, fraud detection and recommendations. Neo4j uses property graphs to extract the added value of data of any company with great performance and in an agile, flexible and scalable way. Neo4j perform better than relation and non-relational database.
In Neo4J we can create a graph using queries as shown in the below images. Some of the examples.

This query will create movie graph
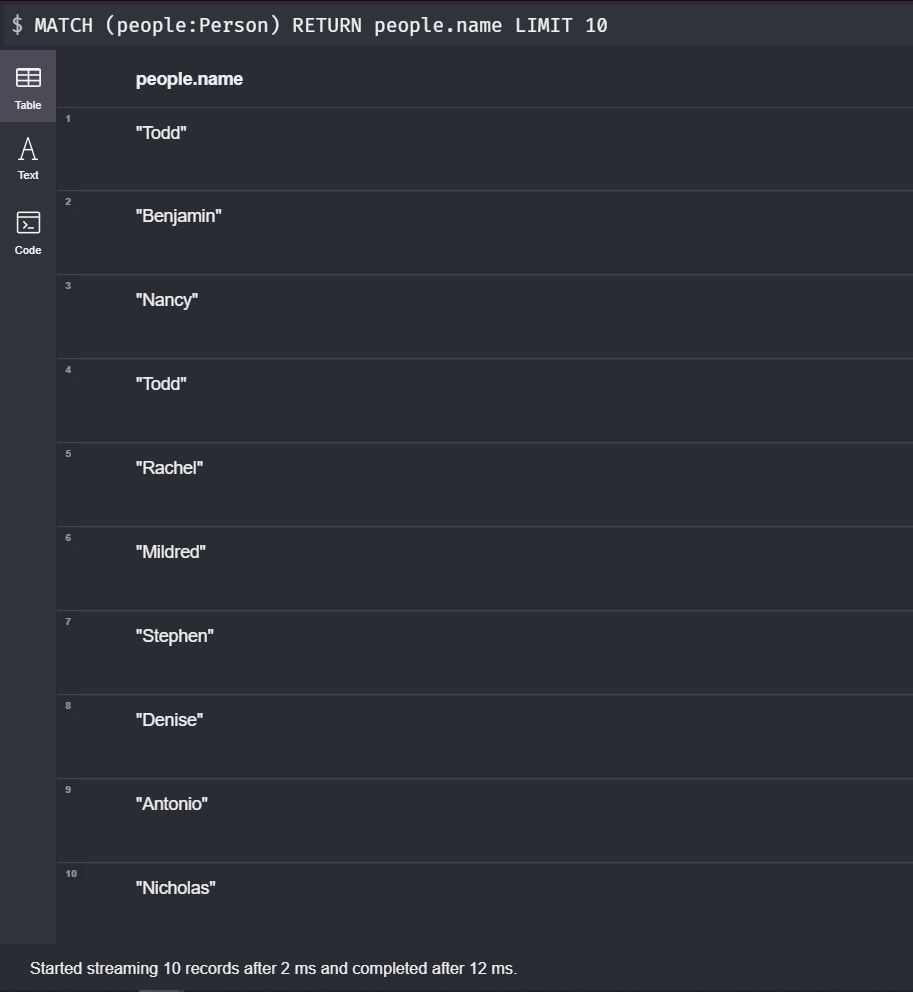
Here in this query, we are trying to get the 10 persons details.

This query will generate a graph of the list of movies of Tom.
Gephi Tool
Gephi is a tool for data analysts and scientists keen to explore and understand graphs. Like photoshop but for graph data, the user interacts with the representation, manipulate the structures, shape and colours to reveal hidden patterns. It is a visualization tool. To develop this tool java language is used.
First, we will take our dataset to perform various operations on it.
Import the dataset into the Gephi tool.

After importing the dataset graph is generated.

Degree Distribution graph of the dataset.


In-degree distribution of the dataset

Outdegree distribution of the dataset
No comments:
Post a Comment